








Description
A Practical Companion to Mastering Market Charts
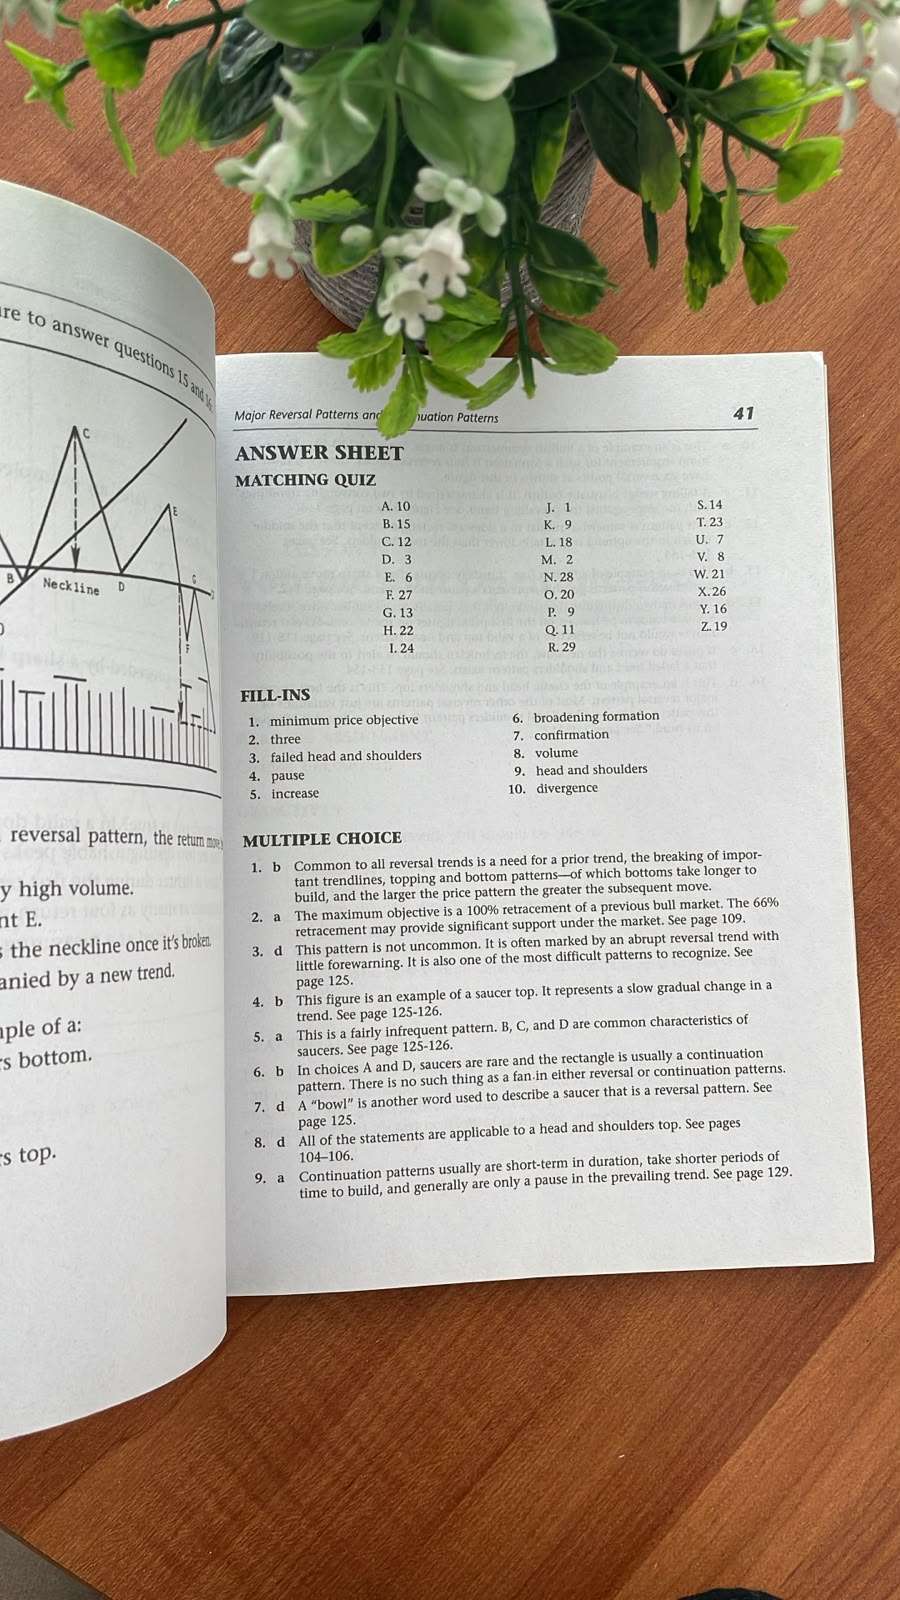
Study Guide to Technical Analysis of the Financial Markets by John J. Murphy is a practical workbook designed to help readers fully understand and apply the principles explained in the classic trading textbook Technical Analysis of the Financial Markets. Instead of simply presenting theory, this study guide encourages active learning through exercises, questions, and examples that reinforce key concepts of technical analysis. The book is widely used by students, traders, and financial professionals who want to strengthen their understanding of market behavior and chart analysis.
The central idea of the study guide is that mastering technical analysis requires practice and structured learning. By working through the exercises, readers develop the ability to interpret charts, recognize patterns, and make informed trading decisions based on real market data.
Learning Technical Analysis Through Practice
One of the main purposes of Study Guide to Technical Analysis of the Financial Markets is to help readers convert theoretical knowledge into practical skills. Technical analysis involves interpreting price charts, market trends, and indicators, which can be difficult to understand without practice.
The guide breaks complex ideas into smaller exercises so readers can test their knowledge step by step. Instead of memorizing definitions, readers learn to identify patterns and apply analytical tools in realistic market scenarios.
Understanding Market Trends
A major section of the study guide focuses on understanding market trends. In technical analysis, identifying whether a market is moving upward, downward, or sideways is essential for making trading decisions.
Through structured questions and examples, readers learn how to:
- Identify primary, secondary, and short-term trends
- Recognize support and resistance levels
- Understand trendlines and price channels
- Interpret market momentum
By practicing these concepts, readers gain the ability to analyze how markets move over time.
Chart Patterns and Price Behavior
Another important topic covered in the study guide is chart pattern recognition. Patterns often signal potential future price movements, making them a key tool for traders.
The exercises teach readers how to recognize patterns such as:
- Head and shoulders formations
- Double tops and double bottoms
- Triangles and flags
- Breakouts and reversals
By studying these formations, readers learn how market psychology influences price movements.
Technical Indicators and Market Signals
The book also introduces readers to technical indicators that traders use to confirm trends and generate signals. These mathematical tools help analyze price momentum and market strength.
Readers practice working with indicators such as:
- Moving averages
- Relative Strength Index (RSI)
- MACD (Moving Average Convergence Divergence)
- Oscillators and momentum indicators
These tools help traders understand when markets may be overbought, oversold, or preparing for a trend change.
Applying Technical Analysis to Real Trading
Beyond theory, the study guide emphasizes practical application. Each section includes review questions and exercises that encourage readers to think like analysts.
By completing the study guide, readers gradually develop a systematic approach to market analysis. This helps build confidence in interpreting charts and making informed trading decisions.
Who Should Read This Book
This study guide is ideal for:
- Students learning financial market analysis
- Beginner traders developing technical skills
- Investors wanting deeper insight into market behavior
- Finance professionals studying market trends
Because it is structured as a workbook, it is especially useful for readers who want hands-on learning rather than passive reading.
Explore This Book
BookLounge:
https://booklounge.lk/product-category/business-economics/
Wikipedia (about the author):
John J. Murphy – https://en.wikipedia.org/wiki/John_J._Murphy
Lasting Impact
After completing Study Guide to Technical Analysis of the Financial Markets, many readers gain a clearer understanding of how financial markets behave. Instead of relying on speculation, they learn structured methods to interpret price charts and market trends.
Ultimately, the book teaches that successful market analysis is not based on guesswork but on practice, observation, and disciplined study of price behavior.





Reviews
There are no reviews yet.